A Comprehensive Introduction to R

Data Science with R: Data Analysis and Visualization

Learn how to load, save, and transform data as well as how to write functions, generate graphs, and fit basic statistical models with data.

R-blue
RDA
1586312208856-2
Certificate Awarded
RDA
Best Data Science Bootcamp Switchup
4.89 / 5
(317 Reviews)
Best Data Science Bootcamp
5 Years Running
Course Report Rating
4.84 / 5
( 322 Reviews)
Best Data Science Bootcamp
5 Years Running

Data Science with R:Data Analysis and Visualization

This course is a 35-hour program designed to provide a comprehensive introduction to R for Data Analysis and Visualization. You’ll learn how to load, save, and transform data as well as how to write functions, generate graphs, and fit basic statistical models with data. In addition to a theoretical framework in which to understand the process of data analysis, this course focuses on the practical tools needed in data analysis and visualization. By the end of the course, you will have mastered the essential skills of processing, manipulating and analyzing data of various types, creating advanced visualizations, generating reports, and documenting your codes.

Unit 1: Basic Programming with R
  • Introduction to R
    • What is R?
    • Why R?
    • How to learn R?
    • RStudio, packages, and the workspace
  • Basic R language elements
    • Data object types
    • Local data import/export
    • Introducing functions and control statements
  • In-depth study of data objects
  • Functions
  • Functional Programming
Unit 2: Basic Data Elements
  • Data transformation
    • Reshape
    • Split
    • Combine
  • Character manipulation
  • String manipulation
  • Dates and timestamps
  • Web data capture
  • API data sources
  • Connecting to an external database
Unit 3: Manipulating Data with “dplyr”
  • Subset, transform, and reorder datasets
  • Join datasets
  • Groupwise operations on datasets
Unit 4: Data Graphics and Data Visualization
  • Core ideas of data graphics and data visualization
  • R graphics engines
    • Base
    • Grid
    • Lattice
    • ggplot2
  • Big data graphics with ggplot2
Unit 5: Advanced Visualization
  • Customized graphics with ggplot2
    • Titles
    • Coordinate systems
    • Scales
    • Themes
    • Axis labels
    • Legends
  • Other plotting cases
    • Violin Plots
    • Pie charts
    • Mosaic plots
    • Hierarchical tree diagrams
    • Scatter plots with multidimensional data
    • Time-series visualizations
    • Maps
    • R and interactive visualizations
$2190

* Tuition paid for part-time courses can be applied to the Data Science Bootcamps if admitted within 9 months

ADD TO CART

Customer Reviews

I really enjoyed the R course with instructor Amy Ma. The content is very practical. It can be directly applied to solve real-world data analysis problem. We had many in-class coding exercises, which helped us understand the R syntax.

Also, Amy tried her best to provide a lot of useful resources. We could tell that she is very passionate about what she is doing, and she is patient with students. We could reach her after class through email, even the course was finished. I highly recommend this course to anyone who is interested in data analysis and wants to learn R from the beginning.

Jiaqi Luo, Fellow, NYC Data Science Academy

I completed the Intensive beginner course for R and I highly recommend it! I’ve learned a lot in 5 weeks and I can say that I am now an R convert (from SAS). I’ve learned so many functions and packages that I am now able to use them confidently at work. Vivian was also a great, hard working teacher who encouraged every one in the class to study harder which means she really cared that that her students would become great data scientists sooner than later. I like the class so much I am now taking the R intermediate class.

Marifel Corpuz, Fellow, NYC Data Science Academy
View more customer reviews

Reasons to Enroll

Instructors

Our instructors are consistently highly rated by their students.  They not only know their subject cold, they are experts at teaching you.

Curriculum

Our curriculum is continuously updated to reflect the latest technology trends.

Technology

Learn on the latest technology.  When you complete this course, you will have a solid foundation in python and the use of the tools.

Sam obtained their Bachelor’s Degree in Mathematics from Bard College, while dabbling in some computer science classes along the way. After school, they decided to make a break from traditional academic life, and worked for several years doing carpentry for places like West Elm, and events like Shakespeare in the Park. Eventually they would turn to the field of Data Science, wherein a passionate blend of creative and analytical thinking can lead to some robust outcomes. They’ve worked in industry building models for Fortune 500 companies that ease the hiring process, and allow for interviewees to be more than just their resume. Their interests include reading, sewing, carpentry, painting, understanding systems, and communicating information effectively to others.

Sam Audino, Data Science Bootcamp Instructor

Your Certificate of Completion

Your Completion Certificate - Just The Beginning

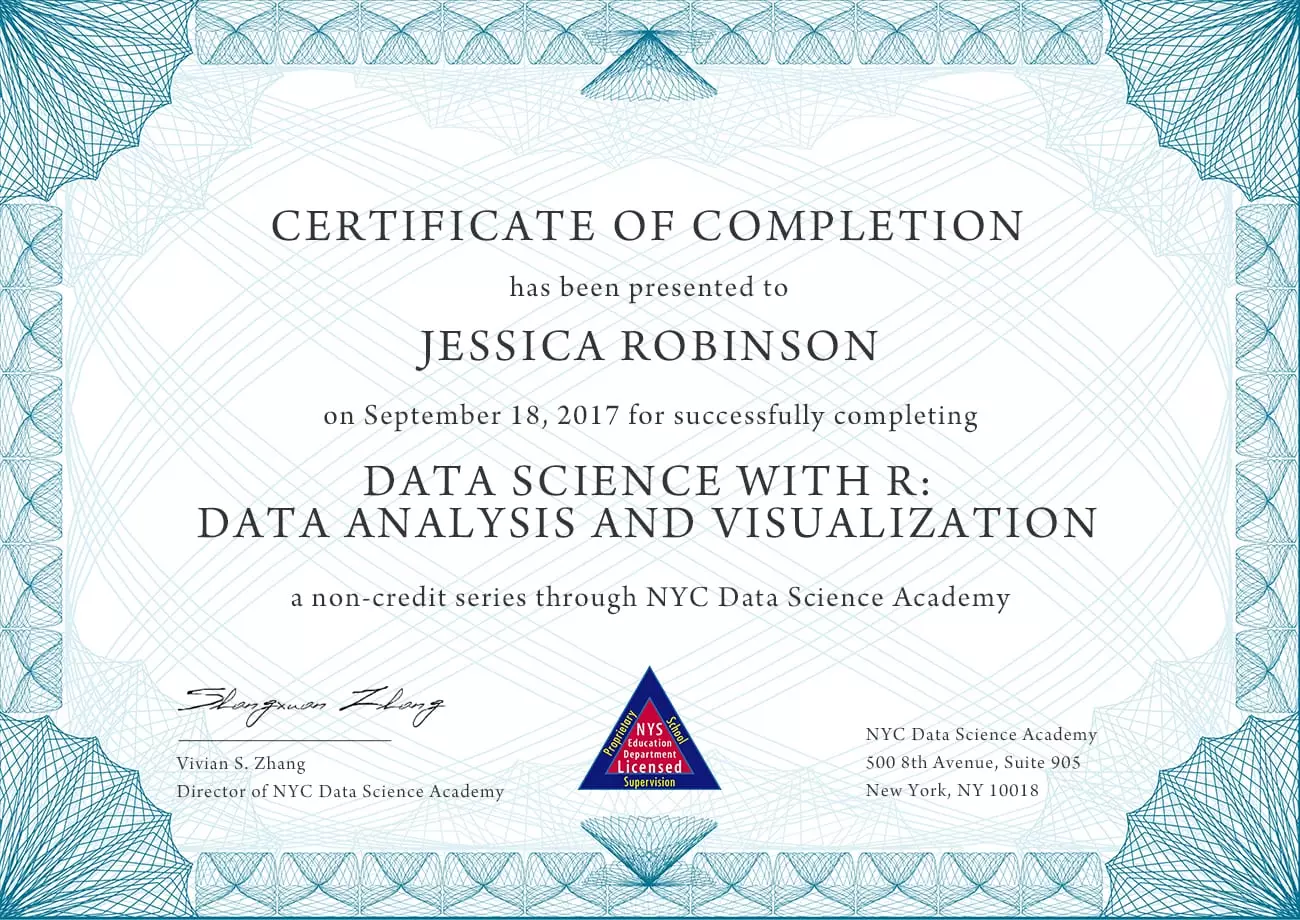
Completing the Data Science with R:
Data Analysis and Visualization course is no small achievement.  It signifies to the world that you successfully learned the foundational R programming skills you will need to progress onto the more advanced R skills and ultimately, completion of our Data Science Bootcamp.

Display it Proudly!

Certificate of Completion

RDA


Character Manipulation

Module
Basic Data Elements
 
Instructor
Jay Lee
 
Description
NYC Data Science Academy's Instructor, Jay Lee, walks through a lecture on regular expression in R.